")


Nishant Batra – Research Head
As always, before coming to the heart of this topic, would like to explain certain things.
Investors today have plethora of investment options to choose from. Investors who accept their inability to pick and track direct stocks consider investing through mutual fund schemes. Mutual Funds are majorly of two types – active funds and passive funds.
In active funds, fund manager takes two active decision, which stock to invest in and in what allocation. Most of the security selection is based on the conviction of the fund manager, which can be biased. In passive funds, both of these decisions are not taken by the fund manager as the mandate is to replicate a portfolio which mirrors the constituents of a market index keeping the proportion same.
You can download the full report from here
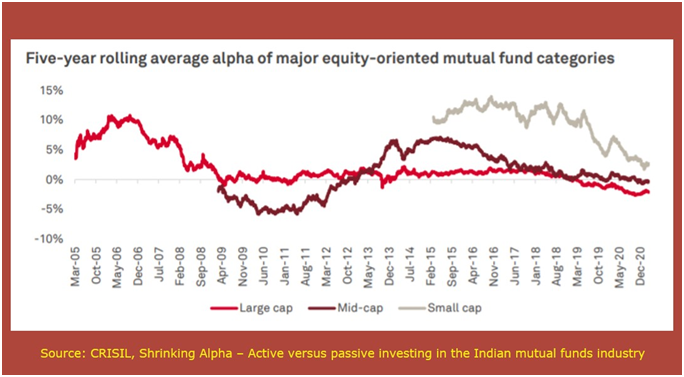
Over the years, the steadily declining Alpha generation of equity funds has made investors look for other low-cost options, or for options which are cheaper than active funds. Apart from traditional market cap weighted index funds like Nifty 50, Nifty Next 50 and Sensex, a new avenue has emerged in the form of smart beta funds. Traditional index funds like Nifty 50, Nifty Next 50 are weighted on the basis of free float market cap. We will come back to smart beta but let’s first try to understand the meaning of beta.
According to capital asset pricing model (CAPM), the returns of a given stock should be a linear function of its beta (i.e. marketrisk). In other words, returns should reflecthow risky a stock is relative to the market.The term “beta” of a mutual fund is simply a measure of volatility of the scheme relative to its benchmark. If beta of a mutual fund scheme is more than one, then scheme is more volatile than its benchmark and on the contrary if beta is less than one, then the scheme is said to be less volatile than the benchmark.
For example: if the mutual fund beta is 1.2, this indicates that, when the benchmark index is up by X%, the fund has historically performed (X% +20%) i.e. 20% better than that index. Similarly, if benchmark index falls by X%, the scheme with beta of 1.2 is expected to decline 20% more than the benchmark.
Smart beta strategies are customized indexes which aim to reduce risk, improve diversification and still enhance potential returns outcome. These strategies seek to deliver better performance, or have less volatility than traditional free float market cap weighted index and have lower expenses than actively managed funds.
Smart beta strategies are based on alternative index construction rules to traditional market capitalization-based indices. They follow passive indices which are constructed based on volatility, value, momentum, quality, etc.Smart Beta strategies are rules-based, systematic approach for choosing stocks from a particular universe (read: index).
In India, following strategies are available for investment through mutual funds:
These are some of the commonly talked about smart beta indexes which are available through MF route:
- NIFTY50 Equal Weight(Index Fund available from DSP, Aditya Birla and HDFC AMC, DSP is soon launching the ETF as well)
- NIFTY100 Equal Weight Index(Index fund available from Principal AMC and Sundram AMC, Principal AMC has been now taken over by Sundram, so these two schemes will merge).
- NIFTY100 Low Volatility 30 Index(ETF and FOF wrapper available from ICICI AMC).
- NIFTY200 Momentum 30 Index(Index Fund available from UTI AMC)
- NIFTY Alpha 50 Index(yet to be launched by Kotak AMC)
- NIFTY Alpha Low Volatility 30(ETF available from ICICI)
- NIFTY Dividend Opportunities 50 Index(ETF available from Nippon)
- NIFTY100 Quality 30 Index (ETF available from Edelweiss and SBI AMC; please note effective October 7th, Edelweiss has converted the ETF into Index Fund)
- NIFTY Midcap150 Quality 50 Index(yet to be launched by UTI AMC)
- NIFTY50 Value 20 Index(Index Fund available from Nippon AMC, ETF available from Nippon, Kotak, ICICI)
I have tried not to miss any ETF or Index fund based on factors which is available as on date.
Now, we will discuss the popular ones in detail.
Nifty 50 Equal Weight
It is one of the simplest smart beta funds possible, it represents an alternative weighting index strategy as compared to its market capitalization weighted parent index, the Nifty50. As the name suggests, the index is weighted equally instead of on free float market cap. The constituents are same as its parent.
Investors who expect all round economic growth and hence broad-based rally should prefer equal weight over market cap weighted index. Broad based rally is one where most of the stocks across most of the sectors perform well as opposed to a narrow rally where only a small set of stocks / sectors perform.
Currently the consensus is that we are in the initial stages of a broad economic growth which should favour all sectors. Investors must note equal weight will tend to under-perform if there is a narrow rally in a few stocks / sectors like the rally of 2018 / 2019. Recall the acronyms HRITHIK (HDFC Bank, Reliance, Infosys, Tata Consultancy Services, HDFC Limited, ICICI Bank and Kotak Mahindra Bank)
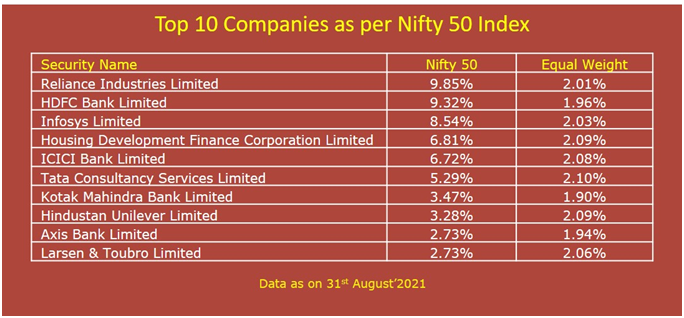
Look at the below image, see how alternative weighting strategy has reduced the concentration risk. The weight of top 10 Companies in Nifty 50 is 58.74% where as the weight of same companies in Nifty Equal Weight is 20.26%
Any change in composition of Nifty 50 (not the weights only the constituents) will trigger change in equal weight index as well. This reconstitution takes place in March and September i.e. semi-annually. However, the rebalancing is done on quarterly basis.
Now let us try to look at the historical rolling returns.
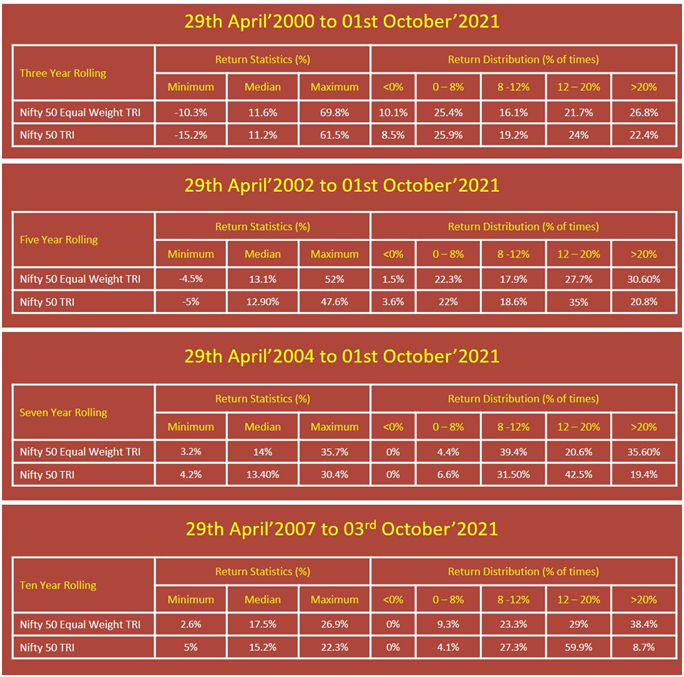
Let’s analyse the rolling returns:
- If you look at the median returns, Equal Weight has done better than Nifty 50 on all time frames.
- Equal Weight has delivered 20% plus returns more percentage of times.
- Maximum return is also greater for equal weight.
- On longer time frames of 7 to 10 years, if we look at minimum returns, traditional index has done better.
Now let’s compare some of the point to point returns:
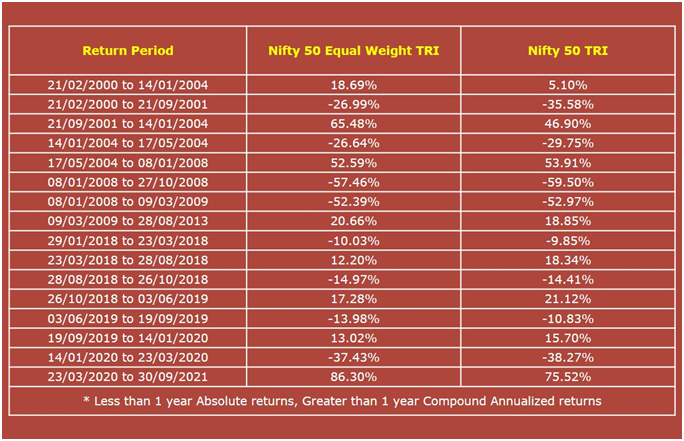
On both the occasions of market crash, Global Financial Crises (2008) and Covid -19 pandemic (2020), Equal Weight has done better than market cap weighted.
From the lows of 2001, 2009 and 2020, Equal Weight has done better. Equal Weight has also done better in capturing the up trends.
Let’s also look at the SIP returns:
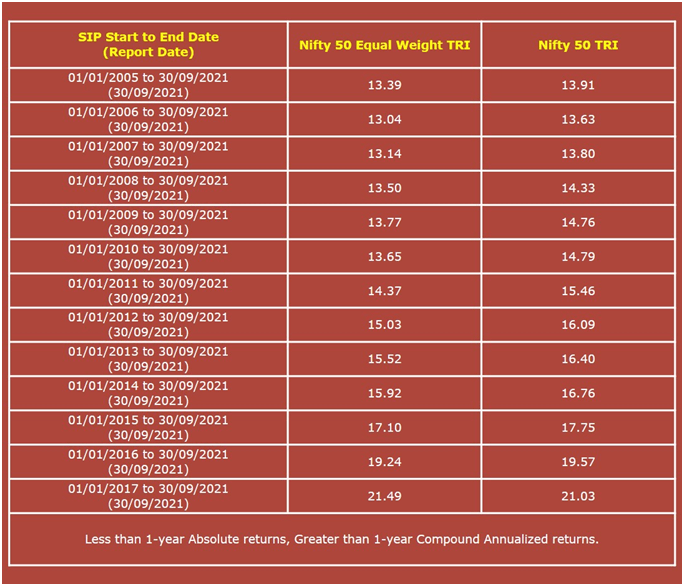
The one thing the investors should keep in mind is, all these returns are calculated using indices values. Practically, you will have to invest through a Mutual Fund ETF or Index Fund to take exposure and these vehicles will deliver slightly less return than indices due to expenses and tracking differences. Also, the cost of smart beta ETFs / index funds / FOF will be more than the cost of traditional market cap weighted ETF / Index Funds.
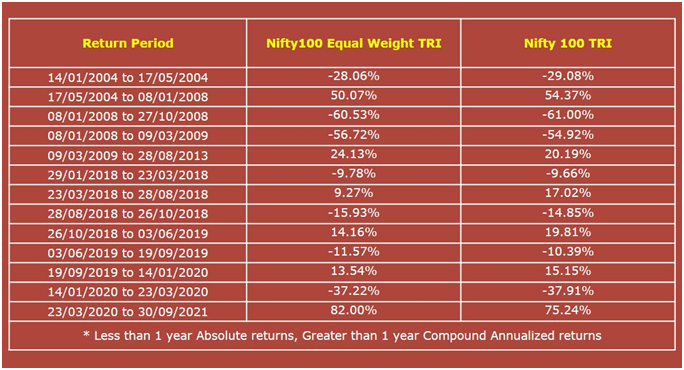
NIFTY100 Equal Weight Index
Plain vanilla offering, 100 stocks (from parent index Nifty 100), 1% allocation each, quarterly rebalancing. After analysing various point to point returns, I am unable to conclude anything.
NIFTY100 Low Volatility 30 Index
Last two indices which we have studied so far are based on different weightage of same set of stocks (market cap vs. equal weight). Going forward, we will discuss smart beta indices where a limited number of stocks are selected from a particular universe based on a pre-set criteria, it can be one or combination of more than one factors – volatility, dividend, momentum, value, quality, etc.
The article will get more and more interesting from now on. Let’s discuss Low Volatility.
There are two schools of thought with respect to risk (read: volatility) and return. Traditional gurus back the concept of greater the risk the greater can be the expected returns. Modern finance professionals have a perspective which is exactly opposite, which is often called as low volatility anomaly: lower the volatility higher the portfolio returns tends to be.
Let me try to explain why this low volatility anomaly works.
The prime reason for this anomaly to work is the lottery ticket effect. Risk-seeking investors prefers to buy volatile stocks to get rich quickly. Second reason is linked with Attention bias. Investors are wired to transact in stocks of companies which are all over the news. Generally, investors end up buying as most investors own only a limited set of stocks and cannot easily sell a stock which they do not own.
In a research paper, dated 27th April’2012, which covered 33 countries and observed data from 1990 to 2011, it has been found that low volatility stocks deliver superior returns. (Baker, Nardin L. and Haugen, Robert A., Low Risk Stocks Outperform within All Observable Markets of the World. You can read here.
There are multiple indices launched by NSE which have low volatility as one of the factors (or only factor). We will discuss only two of them as ETF or Index Funds are available for only these two – Nifty 100 Low Volatility 30 and Nifty Alpha Low Volatility 30.
Nifty 100 Low Vol 30 – here 30 stocks are selected from the universe of Nifty 100 (constituents of Nifty 100 index) stocks on the basis of lower volatility rank. Weights are also assigned on the basis of volatility. Index is rebalanced on quarterly basis.
Let’s first check how low volatility has contained the drawdown in GFC and Covid crash.
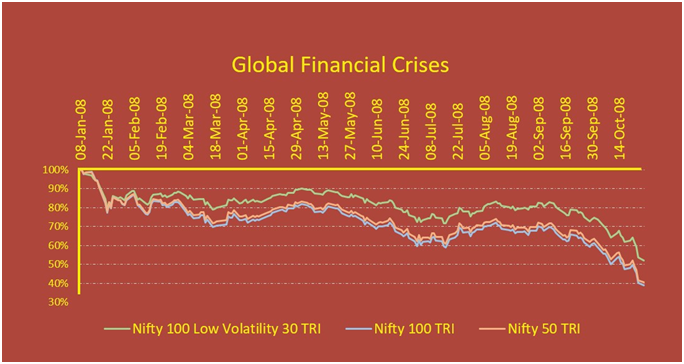
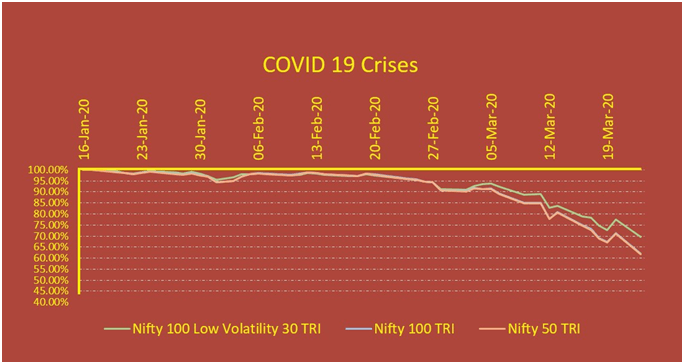
On both the occasions, low volatility fund was able to contain the drawdown by a significant margin.
Let’s also check the rolling returns.
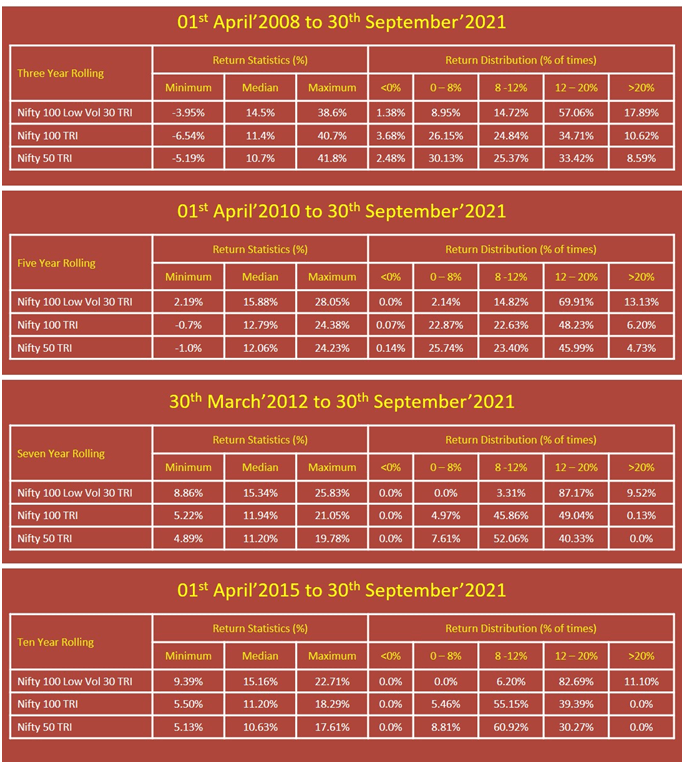
Clearly, Low volatility has performed better than the front-line indices.
Let me know discuss something tricky about the smart beta indices in India. These indices have been launched recently but their base date has been considered a long back. For example, Nifty 100 Low Volatility 30 was launched on 08th July’2016 with a base date of 01st April’2005.
What it actually means is, the index manufacturer, in this case NSE, launched an index in July’2016 and provided the data for it from 01st April’2005. Data was provided on the basis of back testing.
Readers must understand one thing, any index provider is not going to create something, which has poor performance than the frontline indices. Based on quantitative data, index manufacturer, will try multiple filters based on liquidity, momentum score, volatility ranking, valuation parameters, etc. before launching an index. Therefore, the chances are, index manufacture will try to fit the curve till the time it is not looking better than the frontline indices. Here, we must also check the performance from the launch date.
“I’ve never seen a bad backtest” – Dimitris Melas, head of research at MSCI.
Some of you may be thinking, what’s the launch date and base date for Nifty 50 equal weight and Nifty 100 equal weight. Doesn’t matter. As only the weights are changed of constituents of parent index. And we have a “live” history for constituents and changes in them.
Due to limited live data, I am just analysing the 3-year rolling return. On minimum return in the analysed period, low vol has performed better than Nifty 50 and Nifty 100.
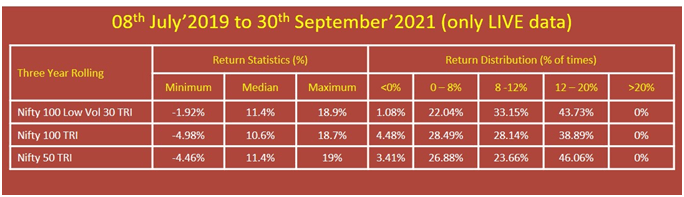
The minimum three years returns, an investor, post the launch of this index and till 30th September’2021 has got is -1.92% whereas the minimum return for investors of Nifty 50 TRI and Nifty 100 TRI, for 3 years holding period, is -4.46% and -4.98%
Similarly, from the launch date to 30th Sept’2021, Nifty 100 Low Vol 30 has generated more than 8% return 77% of times whereas Nifty 50 and Nifty 100 managed to deliver 8% or more returns only 69% and 67% of times.
Overall, it is a simple rule-based strategy and will most probably out-perform in broad market corrections. This strategy can under perform in strong bullish uptrend. This strategy can be combined with other strategies to lower the overall portfolio volatility.
This index can be the Rahul Dravid of your test team.
NIFTY200 Momentum 30 Index
Before studying this index, let’s understand the meaning of momentum.
Buy High, sell higher. Pro-cyclical. Almost opposite to what value investors do. It is based on the observation that securities tend to maintain recent price trends. It sounds so easy but it is totally counter-intuitive and very difficult to internalise and implement in portfolios. It comes with own set of disadvantages as well.
Momentum strategies, based on certain indicators, invest in those securities which are “relatively” stronger than the market. First risk is, if the trend reverses, these stocks may correct more than the market and second risk is of high transaction and taxation due to high turnover (remember, the relatively stronger securities will keep on changing).
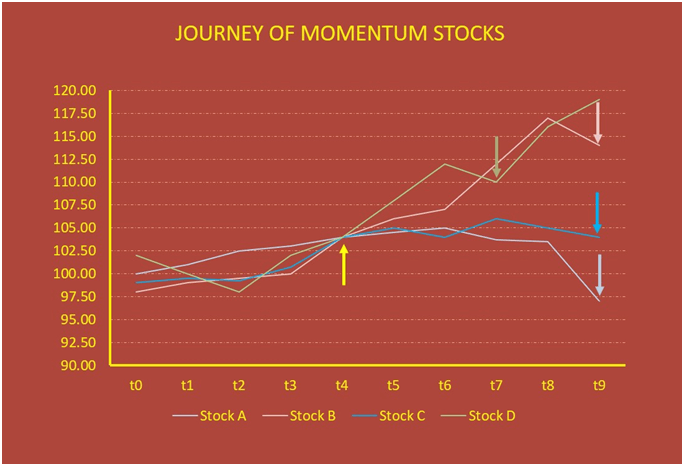
Let me try to explain journey of momentum stocks. The yellow up arrow implies, that four stocks (based on certain filters of the fund manager) have entered the portfolio.
Position for stock A closed in loss. Position for stock B made the most profit. Position of stock C got closed at break even AND Position for stock D also made some profit.
This index which we are discussing, is selecting top 30 stocks, based on momentum score from Nifty 200 to construct the portfolio. Rebalancing after 6 months.
Index was launched on 25th August’2020 and back tested data is available from 01st April’2005.
Below is the rolling return comparison.
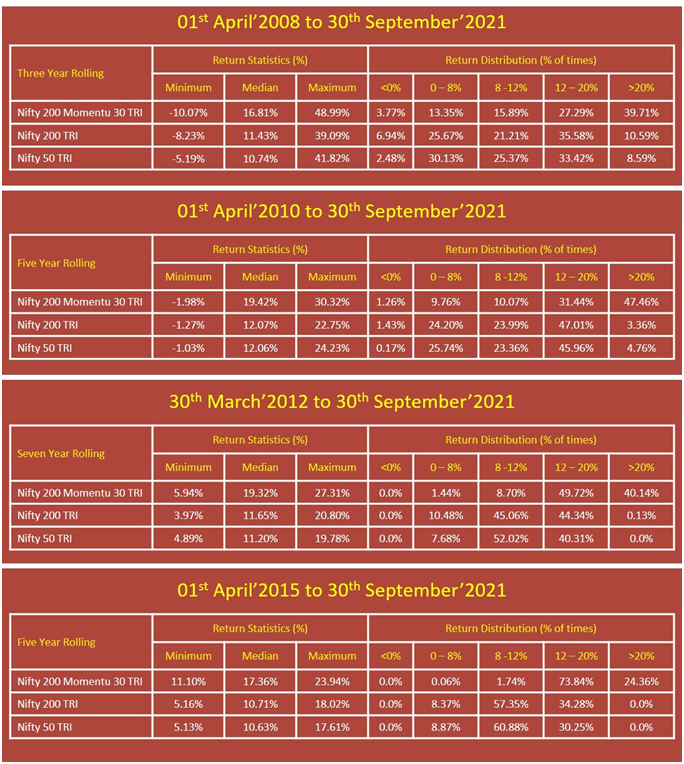
Nifty 200 Momentum 30 TRI index has beaten Nifty 50 TRI on most occasions (for period till 30th September’2021). If we compare the daily rolling for 3,5,7 and 10 years, Nifty 2000 Momentum 30 TRI index has beaten Nifty 50 TRI on 83.5%, 94.5%, 100% and 100% of the times respectively.
The live data has a very short history, so we are skipping analysing it.
NIFTY Alpha 50 Index
It is one of the most awaited smart beta offering. Kotak AMC, sometime back have filed papers for it. But has yet not come out with NFO.
Index was launched in November’2012 with base date of 31st December’2003.
Universe of this index for selecting stocks is based on free float market cap and liquidity of the stock. Top 300 companies based on average free float market cap and average daily turnover for last six months are chosen to form universe. Out of this universe, 50 stocks are selected on the basis of alpha values. Weights are also assigned on the basis of alpha values. Index is rebalanced on quarterly basis.
Let’s compare the rolling returns from base date.
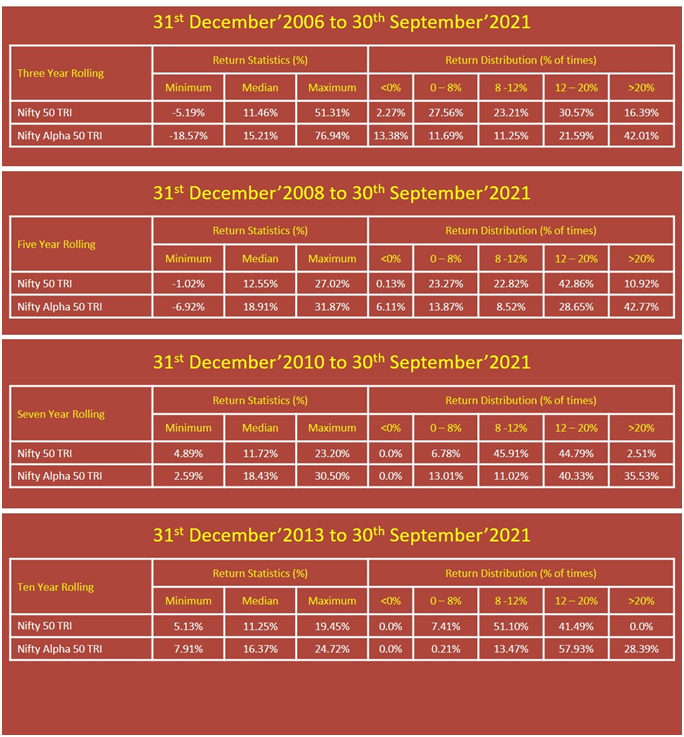
There is a decent history of live data available for this index. Let’s compare that as well.
Look at the five-year rolling returns, 49% of times, Nifty Alpha 50 TRI has given more than 20% returns. Let’s hope either Kotak comes up with the NFO or some other AMC files for it and bring this offering to investors.
NIFTY50 Value 20 Index
20 companies are selected from Nifty 50 as universe based on relatively higher ROCE and Dividend Yield and relatively lower Price to Earnings and Price to Book. Weights of 0.4, 0.3, 0.2 and 0.1 are assigned to ranks of ROCE, PE, PB and Dividend Yield respectively to calculate the final rankings. Top 20 companies based on these rankings are selected. Index is rebalanced on yearly basis.
Let’s look at the rolling returns of this index.
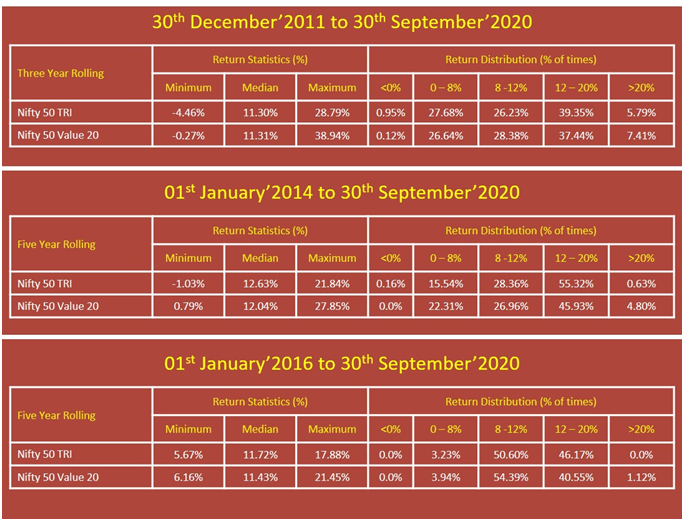
I do not find this index investment worthy …. Why?
The median returns for Nifty 50 and Nifty 50 Value 20 are almost the same for rolling window of 3,5 and 7 years that too on slightly higher volatility.
In five and seven years rolling period, Nifty 50 TRI was able to beat Nifty 50 Value 20 TRI on 58% and 63% of the times respectively.
My take:
I prefer the combination of momentum and low volatility. But the problem with the Nifty 200 Momentum 30 index is that rebalancing is done on half-yearly basis. There is a unique PMS out there which is playing active momentum and rebalancing at monthly basis (with weekly review), but the problem is that of tax inefficiency. The kind of tax arbitrage a MF wrapper can provide (over PMS) can make a huge difference in returns.
If your view is that there will be broad based rally than place your chips on Nifty 50 Equal Weight and Nifty 50 Alpha (please note as on date there is no mutual fund ETF or index fund which is tracking Nifty 50 Alpha).
Nothing in this article should be constructed as investment advice; readers are advised to consult their advisors before making any investment decisions.
Learn Financial Planning through the Certified Financial Planner (CFP®) certification from Financial Planning Standards Board (FPSB) – FPA Courses